The Morning I Gave the Field Guide Eyes
It was 5:30 on a February morning, the coffee still hot and the sky still dark over Oregon City, when Merry’s voice came back to me from a conversation earlier this week. She’d been reading the naturalist narratives on yea.earth (https://yea.earth) — my ecological field guide platform that assembles data from a dozen sources to tell the story of any place on Earth — and she said something that stuck: Claude used to sound like David Attenborough, weaving place and nature together into something you wanted to keep reading. Now it sounds like a textbook.
She was right, and I finally understood why.
The paradox is almost too clean: I had made yea.earth better, and the narratives got worse. Over the past two weeks I’d enriched the data scaffold substantially — adding Macrostrat geology, ERA5 climate history, LANDFIRE vegetation typing, BirdWeather acoustic detections, water balance calculations, phenological seasonality data. The structured cards that feed the AI interpreter had grown from a handful of facts to a dense, multi-layered ecological profile for every coordinate on the planet. More data. More sources. More precision. And the AI responded exactly as you’d expect — it became a dutiful reporter, touching every card, honoring every number, producing narratives that were accurate, comprehensive, and utterly lifeless.
David Attenborough would never do this. He doesn’t inventory a landscape; he selects. He walks past a hundred details to tell you about the single orchid that reveals the whole ecosystem’s logic. The data informs his understanding, but it never dictates his narration. His knowledge is invisible scaffolding; what you experience is story.
That distinction — between knowledge that informs and data that dictates — turned out to be the key to everything that happened next.
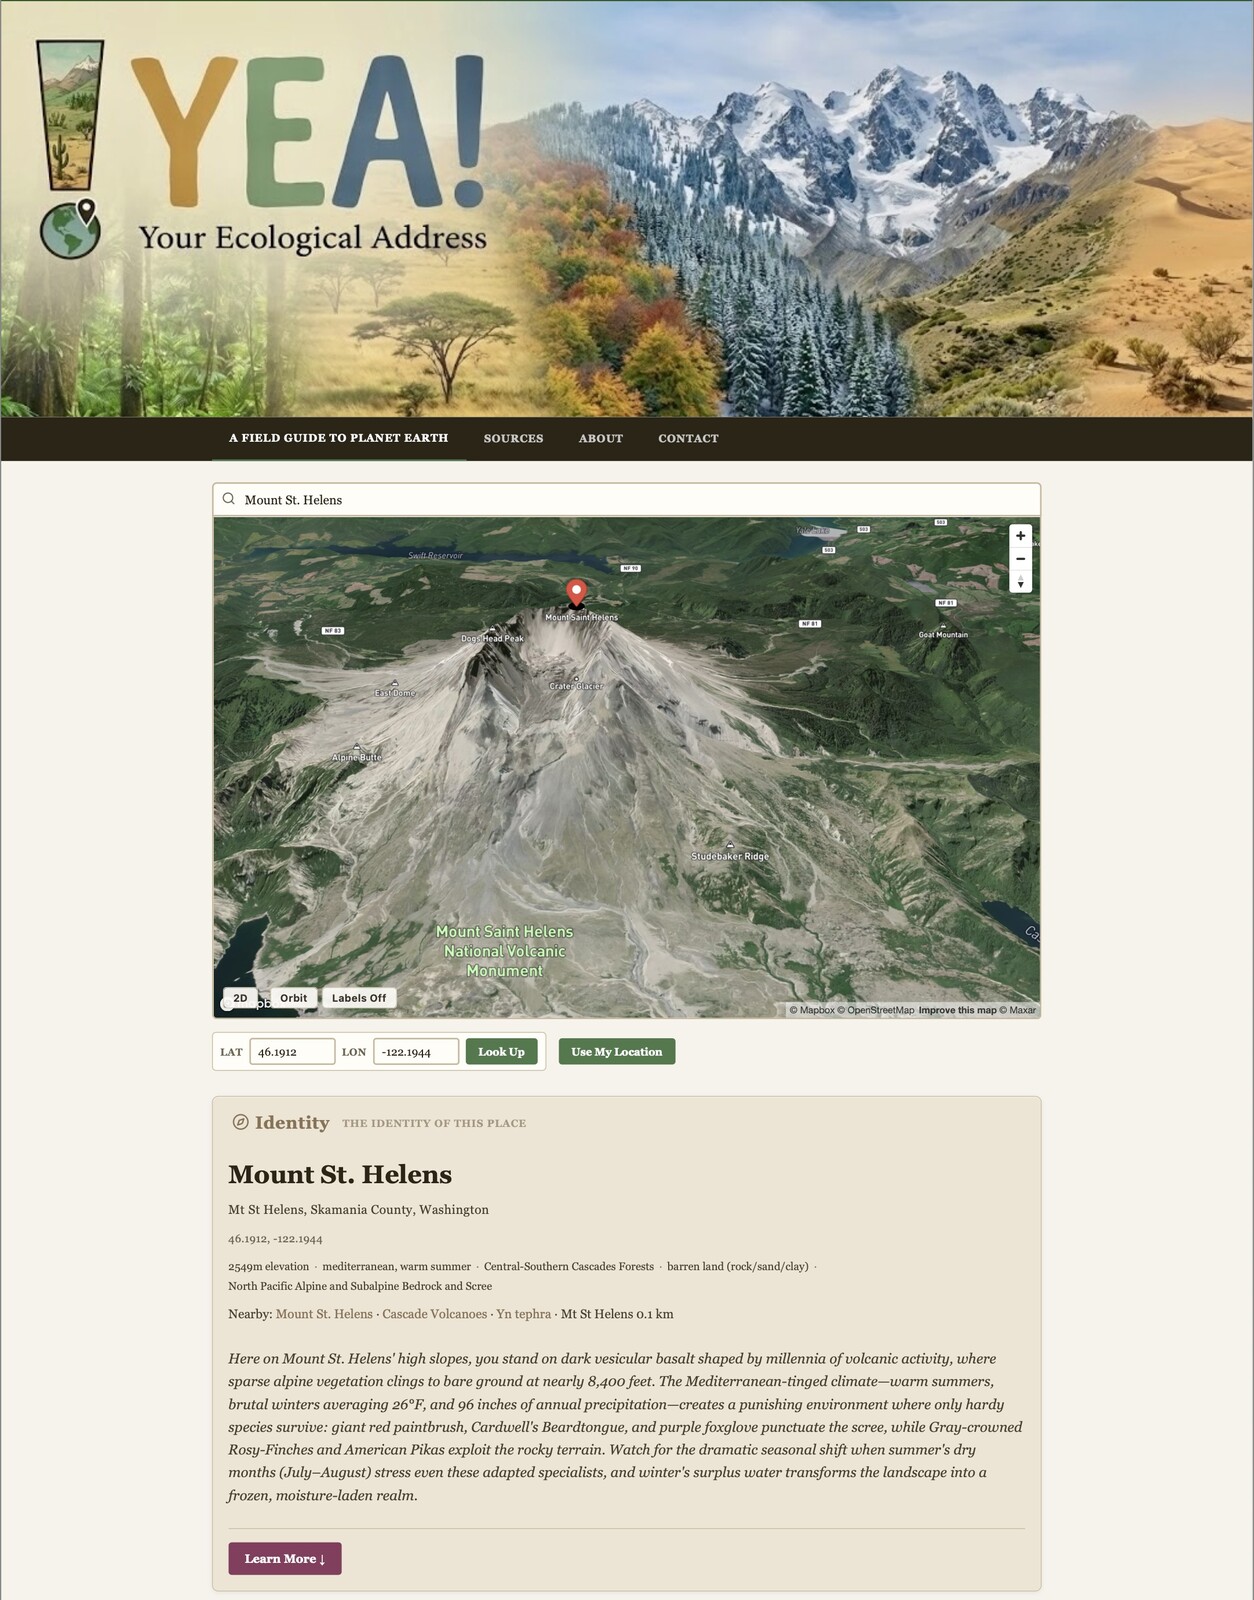
Yesterday, I’d been working on yea.earth’s 3D visualization, and something shifted. The platform uses Mapbox GL to render terrain, and switching to the orbital 3D perspective for the first time with realistic satellite imagery draped over elevation data produced something I hadn’t expected. Mountains compelled me to explore them. The landscape had depth — not just cartographic depth measured in contour lines, but perceptual depth, the kind that makes you lean forward and want to fly into the scene. A 2D map is an abstraction you read. A 3D landscape is something you inhabit, even if only with your eyes.
This is not a minor aesthetic point. It represents a fundamental shift in cognitive mode. When I look at a flat map of Oregon City with green polygons labeled “Atkinson Park” and “open space,” I’m processing symbols. When I orbit a 3D view and see the massive canopy south of Atkinson Park clinging to a slope too steep to develop, houses packed tight on the flats between numbered streets, and a thin corridor of tree cover threading northeast along what must be a creek draw — I’m reading a landscape. I’m doing what I’ve done for as a field ecologist: interpreting spatial relationships that no single data layer contains.
So I posed a challenge to Claude during that morning’s coffee session. I shared the 3D view of Oregon City, the full data scaffold from yea.earth, and a simple prompt: you have eyes, you have the data, now fly like a raptor over this place and tell me what you see as a naturalist.
What came back stopped me mid-sip.
Claude described the geometry of two competing grids — the Cartesian order of numbered streets imposed on terrain that never asked for it, and the older drainage grid that geology drew underneath. It noticed that the massive canopy patch survived not because someone loved those trees but because a bulldozer couldn’t get purchase on the slope. It traced the thin corridor of tree cover connecting that patch to riparian vegetation along a creek draw and identified it as a critical connectivity thread — if someone builds on that thread, the patch becomes a true ecological isolate. It described the settlement pattern of a mill town where workers walked to work, the thin deciduous canopy over thermally exposed residential blocks, the abrupt edges where houses back directly against forest and invasive species like tree-of-heaven colonize the margins.
None of this was in the data cards. The data cards say “71m elevation, Developed Open Space, 355 species within 1 km.” What Claude described came from looking at the image and reasoning spatially about what it saw, informed by the ecological knowledge scaffold underneath. It was doing what I do when I strap on my drone visor and fly my little 250-gram quadcopter over the neighborhood — hovering, watching, reading the landscape from the one vantage point my bipedal body can never provide.
That’s when the architecture revealed itself, clean and simple as a circuit diagram. Four components: vision — the 3D rendered landscape at a specific location; scaffold — yea.earth’s structured data providing the factual substrate; persona — a prompt placing the observer in a specific interpretive frame; and synthesis — the model fusing visual pattern recognition with ecological knowledge to generate observations that exist in neither the image alone nor the data alone, but emerge from their intersection.
Every component is location-independent. Yea.earth (https://yea.earth) scrapes the data scaffold for any coordinate. Mapbox renders 3D terrain for any coordinate. The persona prompt is portable. And the vision-language model travels everywhere. What we had demonstrated for Oregon City at 45.3615, -122.5942 could be done for a hillside in Oaxaca, a fjord in Norway, or a savanna in Kenya — not the same canned text rephrased, but genuinely new spatial-ecological interpretation arising from the unique intersection of what’s visible in the terrain and what’s known in the data at that specific place.
I said to Claude: that’s a tricorder.
And it is. Not the prop from 1966 with its blinking lights and single-point readings, but something closer to what the writers imagined Spock was actually doing — coupling instrument data with scientific understanding and contextual reasoning to produce synthetic interpretation on the fly. The tricorder was never just a sensor. It was a sensor coupled to an interpreter. And Spock didn’t get a spreadsheet; he got a story grounded in data but narrated by expertise.
The fix for Merry’s complaint now seemed obvious. The current naturalist narratives are data-to-prose — the AI reads the cards and writes about them. The new architecture would be data-plus-vision-to-interpretation. The persona prompt doesn’t just say “you are a naturalist.” It says something more like: “you are a naturalist who has internalized this data the way a field ecologist internalizes decades of reading. It shapes what you notice, but you never lecture. You show. You pick the one detail that unlocks the whole. You trust the landscape to tell its own story.” That’s Attenborough’s method, made into a designable, tunable, testable prompt.
But the morning wasn’t done with me yet.
I’d read an article yesterday in Nature that had triggered my spider sense for technology trends. A platform called RentAHuman.ai had launched — a website where AI agents can hire humans for physical-world tasks. The framing was deliberately provocative: “robots need your body.” Over 450,000 people had signed up to be “meatspace workers,” available for tasks that AI agents can identify but can’t physically execute. Count pigeons in Washington Square Park. Try an Italian restaurant. Upvote a social media post for a dollar.
The researchers quoted in the article were right to be skeptical. One called it a gimmick, social commentary playing on fears of AI autonomy. Another pointed out it was basically Mechanical Turk with a provocative rebrand. The tasks are trivial, the payments insulting, and the whole enterprise runs on the novelty of inverting the employment relationship.
But strip away the branding, and there’s an architectural pattern worth taking seriously: an AI system monitors data, identifies something it cannot accomplish in the physical world, formulates a task specification, and recruits a human with appropriate capabilities to execute it. That’s not inherently gimmicky. That’s a protocol.
The connection to the tricorder hit me while I was still holding the coffee mug.
What if the yea.earth (https://yea.earth) agent — already monitoring acoustic detections, weather data, iNaturalist observations, phenological patterns, and water balance calculations for any curated place — could watch the time series, detect anomalies and trends, and then do something that no database can do: ask a scientific question? Not a vague flag that something interesting is happening, but a structured, testable hypothesis grounded in the data. And what if that question came packaged as a field protocol — a specific set of observations to make, measurements to take, photographs to capture — that a student or citizen scientist could carry into the field?
The BirdWeather station detects Varied Thrush three weeks ahead of the ten-year median first arrival date. The agent formulates the question: is this an individual outlier, or are multiple indicators converging on an advanced spring? It writes the protocol: visit the riparian corridor at these coordinates, document flowering status of red-flowering currant and Indian plum, photograph bud stage, record ambient temperature at canopy and ground level, note presence or absence of other early migrants. Return observations here.
That is the inversion of RentAHuman that transforms it from gimmick to something profound. The AI isn’t hiring a body to count pigeons. It’s mentoring a naturalist. The student who walks that protocol isn’t performing a mechanical task for a dollar — they’re learning to see ecologically, to connect acoustic data with phenological observation with climate pattern, guided by a question that emerged from real data about a place that already matters to someone.
And the curated places layer is what makes it matter. I began work on this new "data layer" this week where I can incorporate the many places that I like to visit, or for example the ecological profiles and 360 videos that 33 biological field stations across the country documented during lockdown (https://canemah.org/projects/ecoSPLAT/viewer/). These aren’t random coordinates. They’re places where a naturalist, a teacher, a reserve manager, or a local community has already said: this place is important, and here’s what we know about it — field notes, photographs, species lists, 360-degree panoramas, annotated videos. The AI agent doesn’t just notice that something changed in a time series. It notices that something changed in a place with enough accumulated context to make the change meaningful and the question answerable.
Then the student returns from the field with new observations, new photographs, new data — and that material flows back into the curated place record. The place gets smarter. The data stack deepens. The agent has more to work with for the next question. It’s a flywheel of ecological understanding, powered by the complementary strengths of machine intelligence and human presence.
I drained the last of the coffee, peeled my final mandarin slice, and sat with the quiet satisfaction of a morning where separate threads had woven themselves into a single fabric. The 3D visualization gave the field guide eyes. Merry’s critique showed that more data without perceptual grounding produces less understanding. The tricorder architecture demonstrated that vision plus data plus persona yields genuine interpretive synthesis. And the RentAHuman inversion revealed that the same agent that sees and interprets can also teach — not by lecturing, but by asking the right question at the right place at the right time, and guiding a human into the field to find the answer.
Years ago, I made the world’s first ecological movie map, trying to give people a way to see landscapes as ecologists see them. The tools have changed beyond recognition. The ambition hasn’t changed at all.
Time for the hot tub.
References
- - Ahart, J. (2026). “AI agents are hiring human ‘meatspace workers’ — including some scientists.” *Nature*. https://www.nature.com/articles/d41586-026-00454-7 ↗